
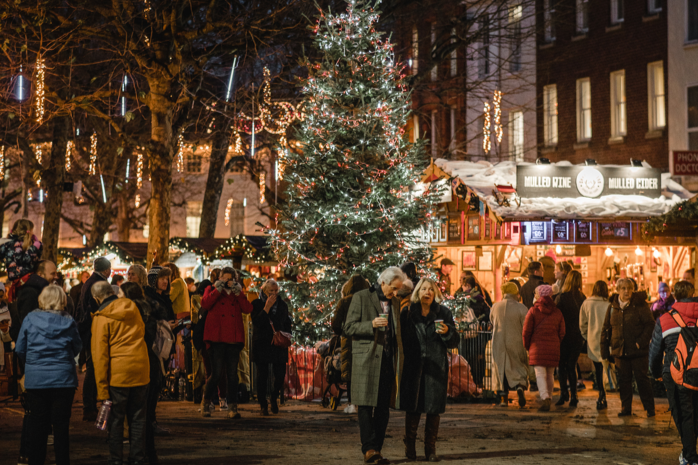
York City Centre Insights
It goes without saying that 2023 has been a challenging year for businesses operating on UK high streets. The cost of living crisis coupled with rising inflation has raised concerns over reduced consumer spending, whilst rail strikes and bad weather have intermittently impacted visitor numbers. Furthermore, the costs of running a bricks and mortar property and paying members of staff continue to ramp up.
Despite the doom and gloom regularly seen in the media, there are several indicators to suggest York is attracting healthy numbers of visitors. This report brings together data from multiple sources to offers a range of insights on the recent performance of York city centre.
Data Headlines
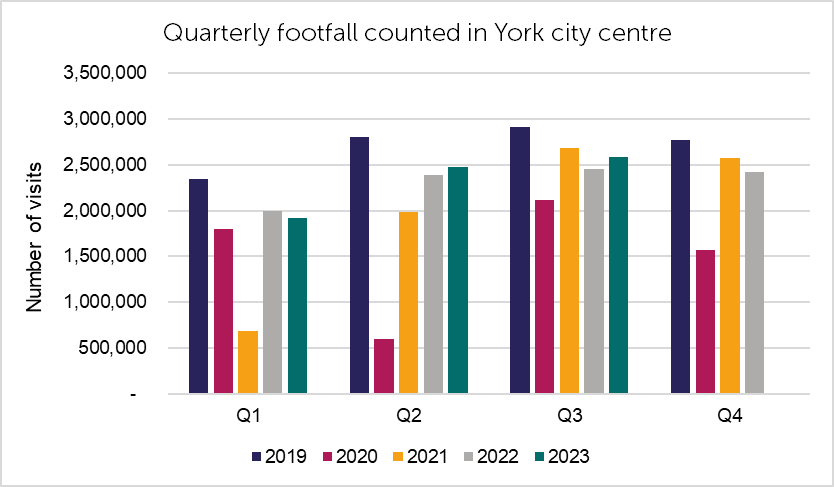
Footfall counted during quarter 3 of this year was up by 5.4% when compared to the same period in the 2022, and down by -11.2% compared to pre-COVID levels (See figure 1).
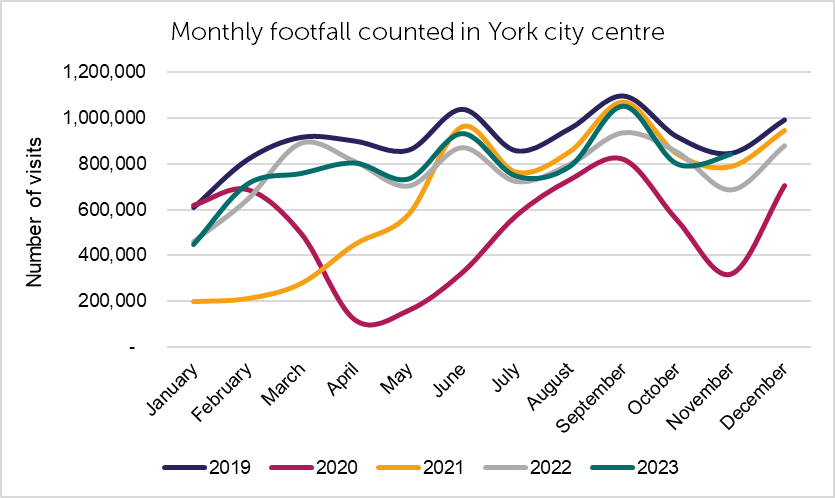
The highest number of monthly visitors this year was recorded during September: up by 12.5% compared to the previous year and -4.3% down on pre-COVID levels (See figure 2).
During November, the number of visitors counted nearly reached pre-COVID totals: -0.8% down compared to 2019 and 22.7% up on compared to the previous year. (See figure 2).
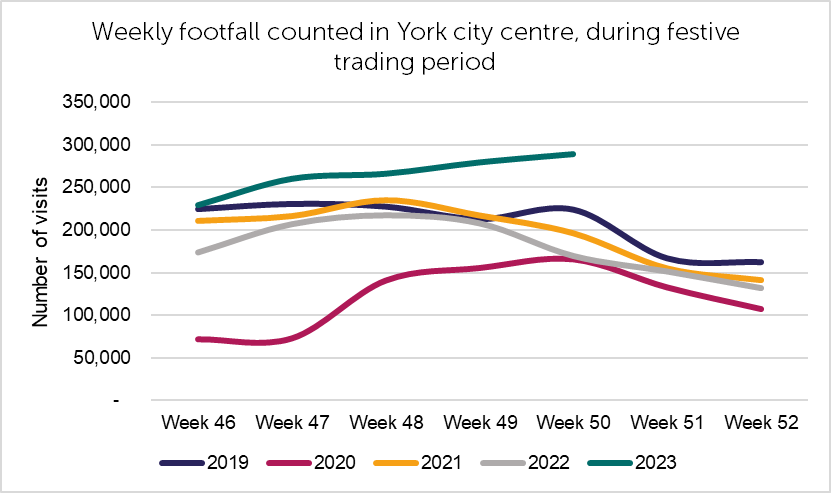
Weekly footfall totals recorded during first 5 weeks of the York Christmas Market were the highest witnessed in the last 4 years: up by 36.9% on average compared to the previous year, and up by 18.1% on average compared to pre-COVID levels (See figure 3.)
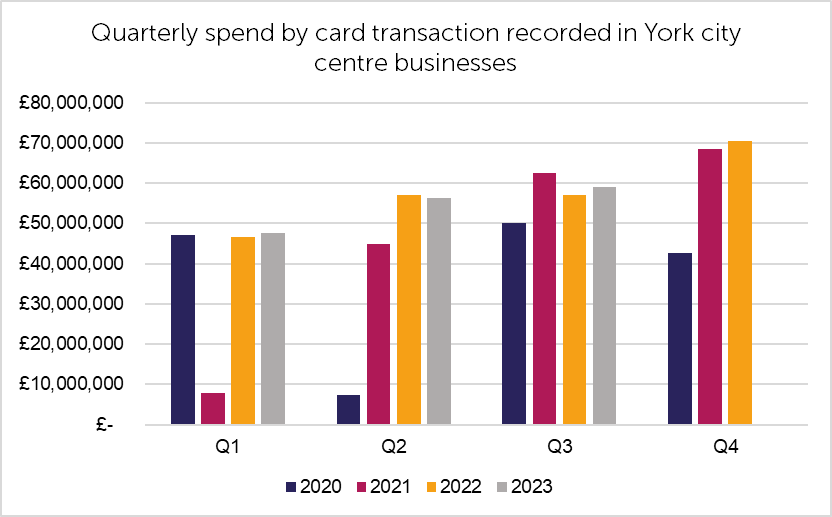
Spend in businesses during quarter 3, made by VISA card transaction increased by 3.4% compared to the previous year. Residents of York Local Authority area account for 28% of the total spend (See figure 4).
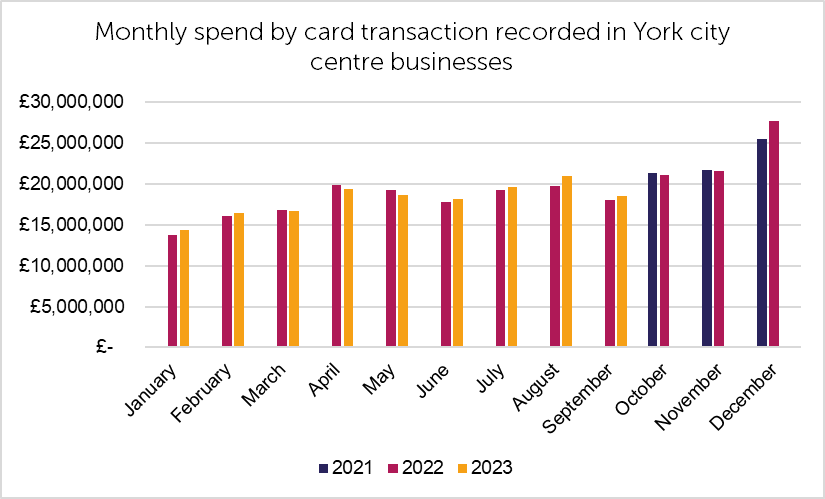
The largest increase in spend was observed during August which of was 5.7% up on the previous year (See figure 5).
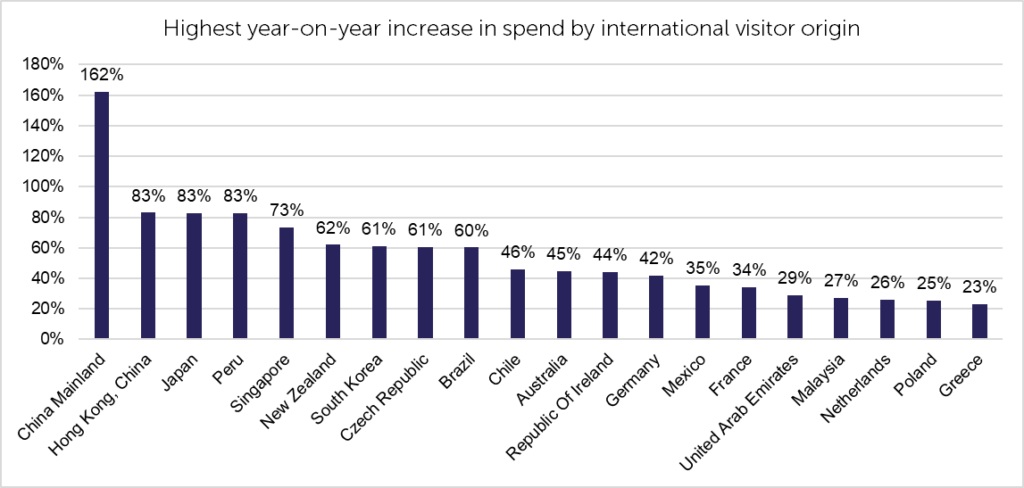
During quarter 3 2023, card spend made by Chinese, Hong Kongese and Japanese visitors increased by 109% on average, compared to the previous year (See figure 6).
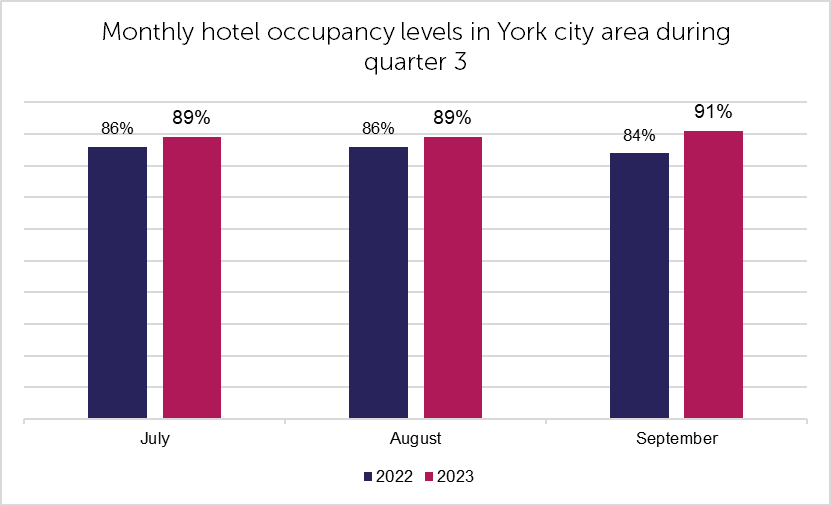
Monthly hotel occupancy across the York city area was 4.3% higher on average during quarter 3 than the previous year (See figure 7).
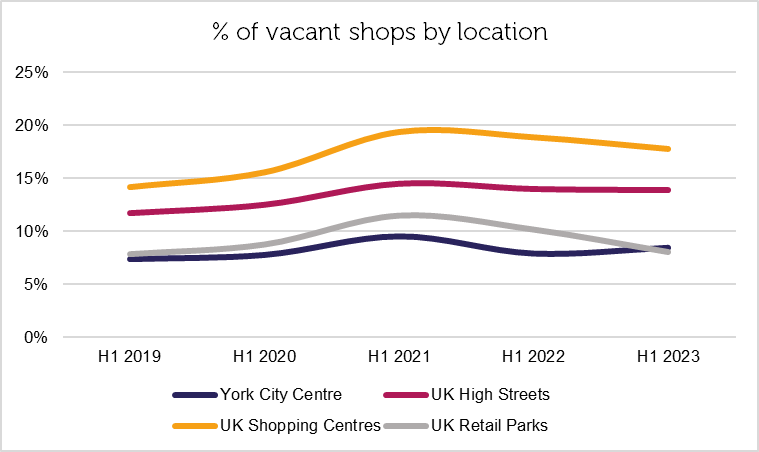
Shop vacancy levels in York city centre are slightly elevated, increasing by 0.6% compared to last year, but remain well below the national average for UK high streets (See figure 8).
To see our previous reports please visit our Insights & Trends page. If you have any questions regarding the data, you are welcome to contact a member of the BID Team at info@theyorkbid.com.